Charts in Game UI
6/6/2024
Veneta Kochovska, Kaloyan Geshev
Charts within a game UI are essential for displaying various statistics, such as resource changes over time, leadership standings, and player attributes like accuracy, kills, deaths, and wins.
Gameface supports d3 , a JavaScript library for creating and manipulating SVG elements for data visualization. You can build and customize various charts using its low-level API .
Currently Gameface has full support for version 4 and below of the D3JS library. Newer versions have only partial support so the examples shown in this tutorial may not work with it.
Showcase overview
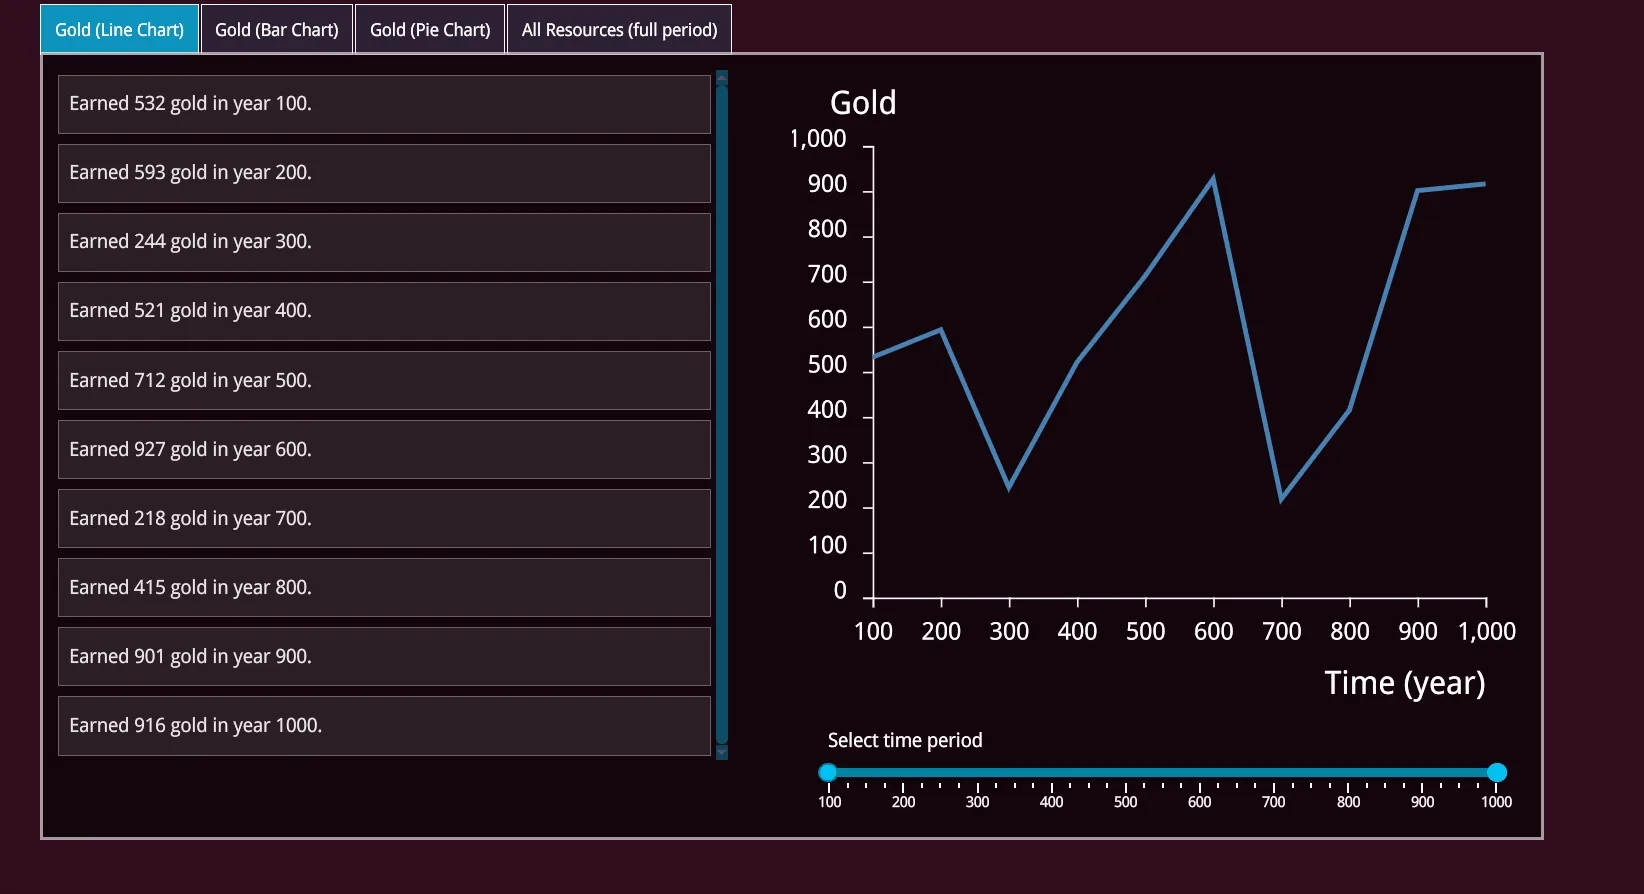
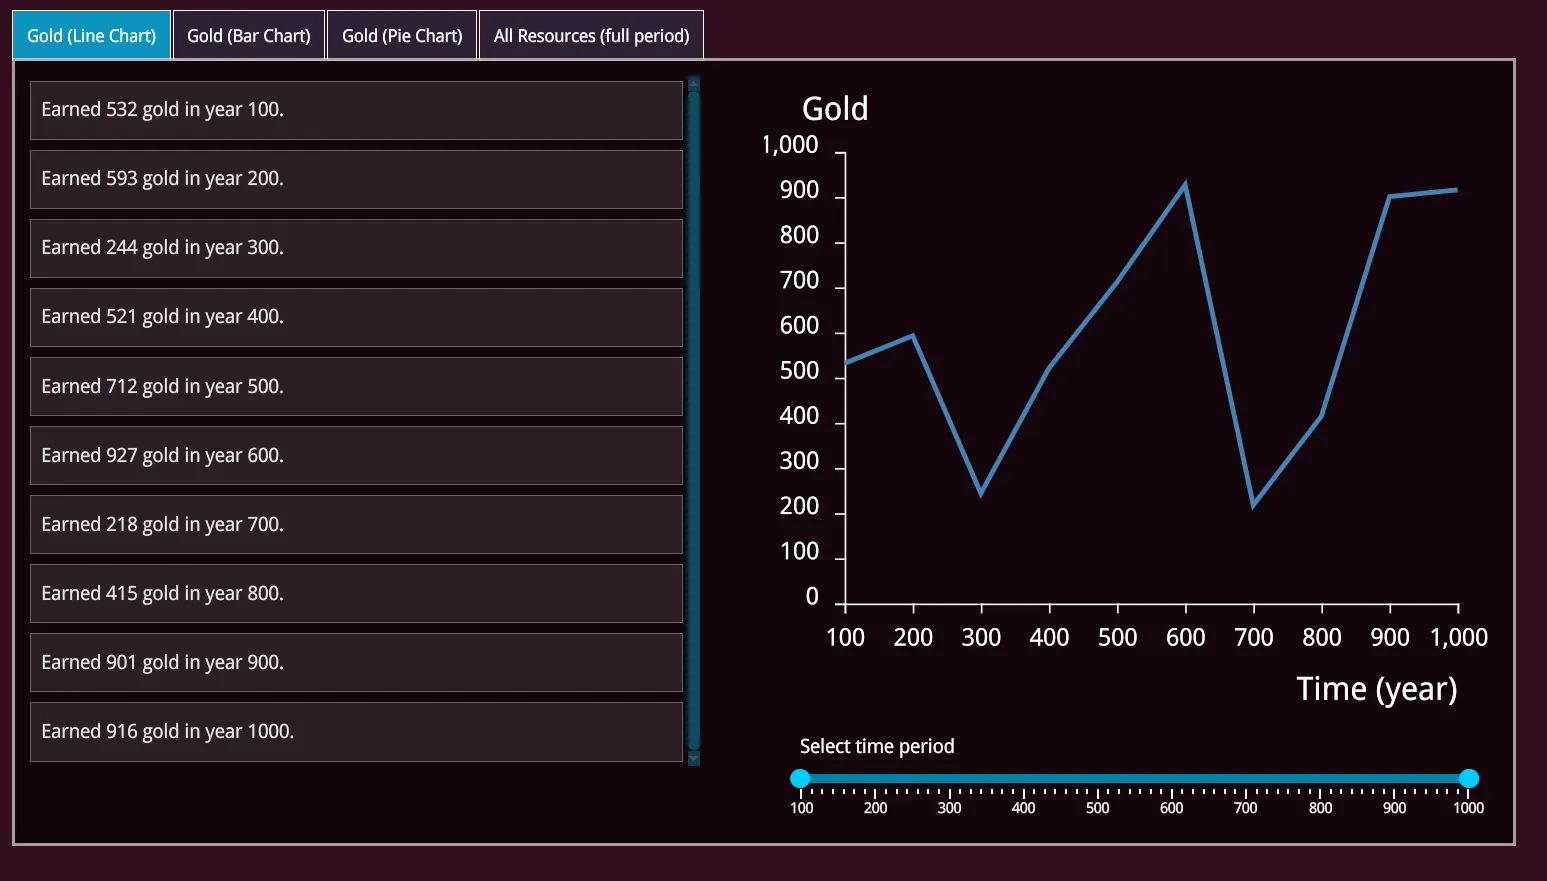
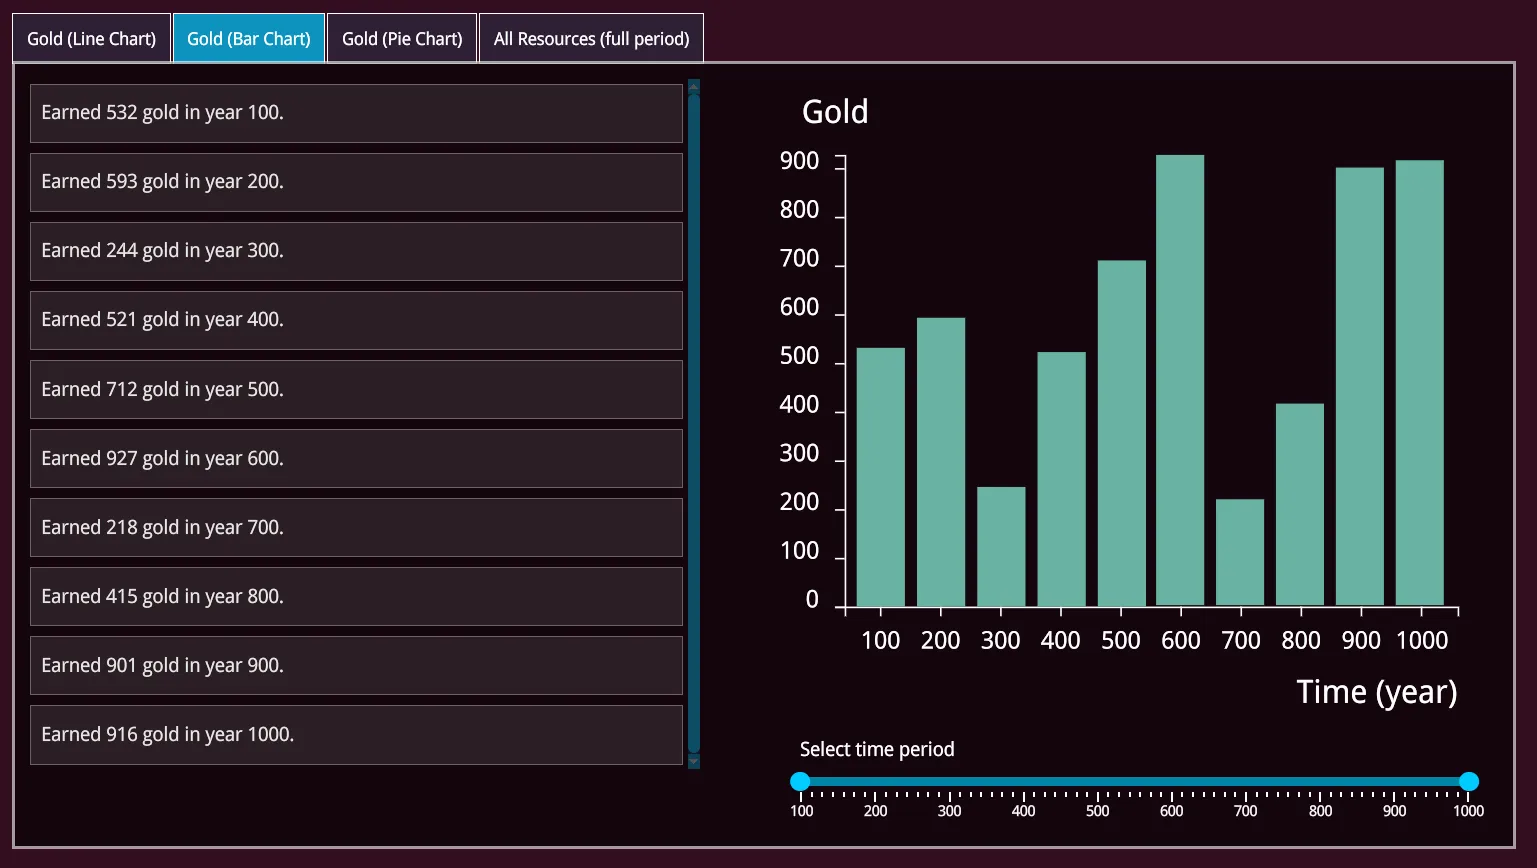
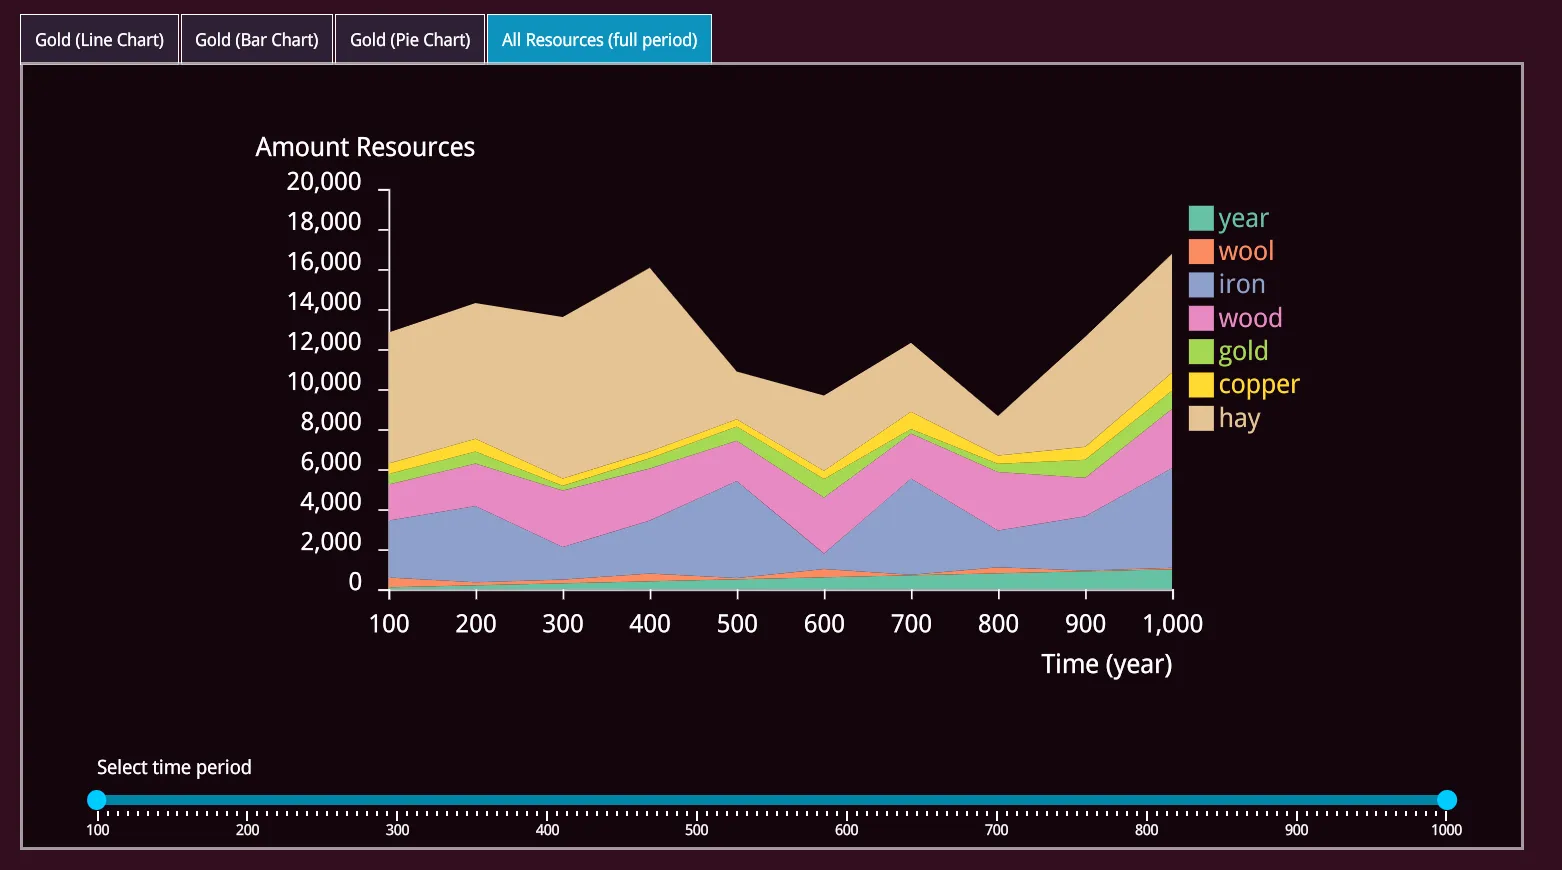
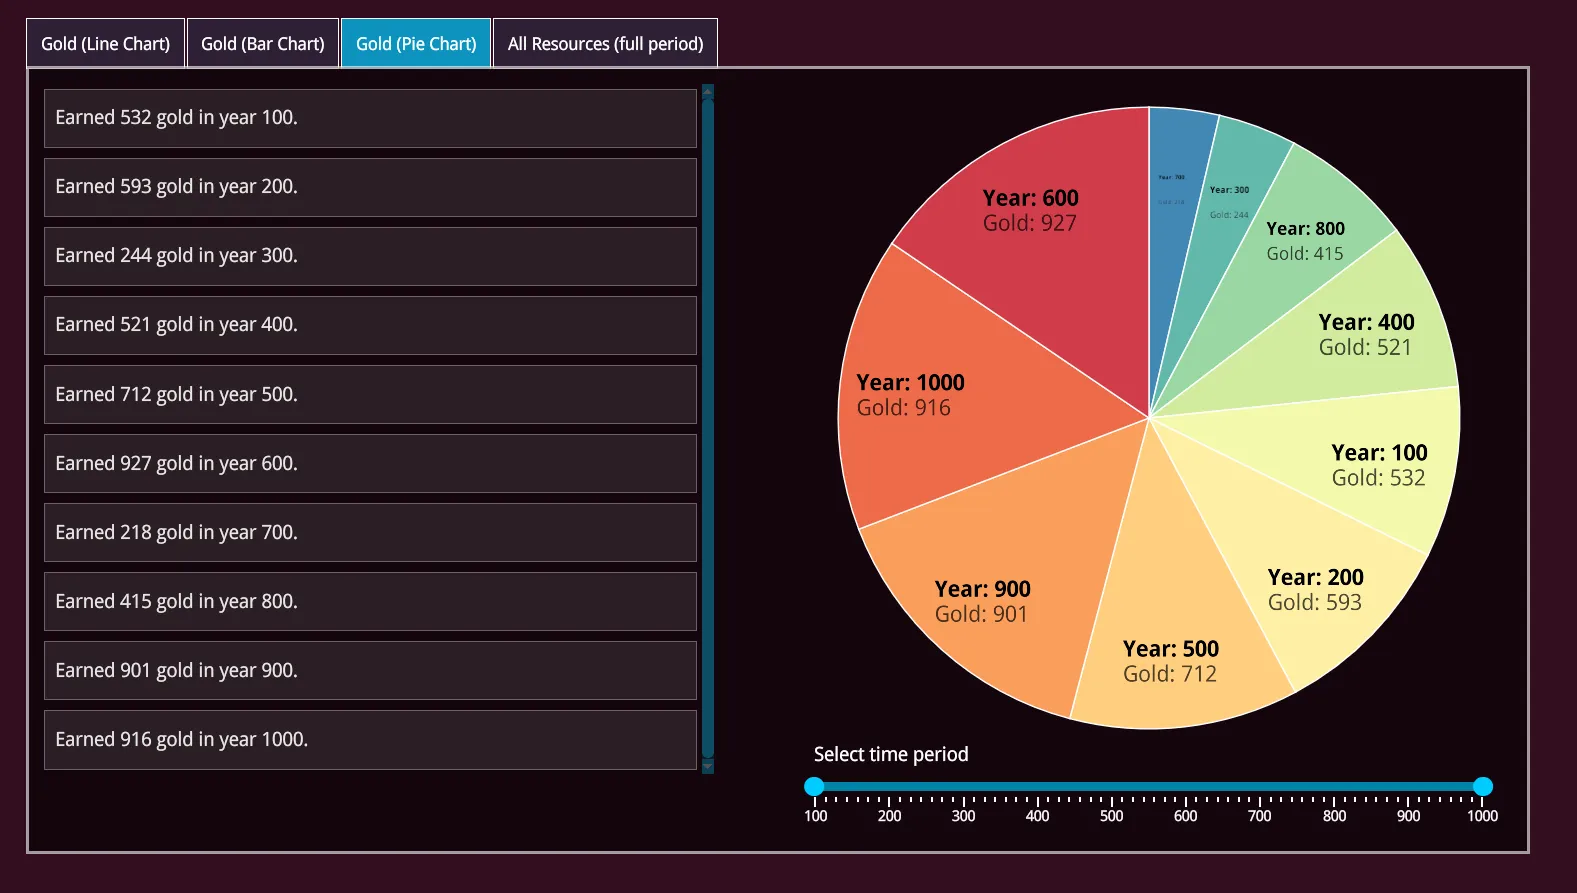
In this example, we created a window that presents data through various charts made with d3.js. We have implemented a line chart, bar chart, and pie chart displaying data about gold per year. Additionally, we have an area chart that shows all resources over the period between 0 and 1000 years.
Each chart includes a range slider below it, allowing you to adjust the displayed data period and showing you how to manipulate the shown data in real time.
Source location
You can review the complete sample source within the ${Gameface package}/Samples/uiresources/UITutorials/StatisticsScreen directory.
Sample specifics
Importing the d3.js library
The easiest way to import d3 is by using their provided CDNs (Content Delivery Network).
1<script src="https://d3js.org/d3.v4.js"></script>2<script src="https://d3js.org/d3-scale-chromatic.v1.min.js"></script>d3.js charts
We used some pre-made examples from the d3-graph-gallery and adapted them for our demo needs. If you’re not familiar with the d3.js library, please refer to the documentation on their website before customizing the charts.
For each chart, we created a separate file that creates the chart and has an update method to refresh the chart based on new data and range. You can check src/areaChart.js, src/barChart.js, src/lineChart.js, and src/pieChart.js.
Chart data
Random data generation is handled in the src/generateData.js file. The generateChartData method regenerates the data based on the year range and specified labels.
1function generateChartData(labels, yearsRange) {2    const chartData = [];3    const years = generateYearsFromRange(yearsRange);4
5    for (let i = 0; i < years.length; i++) {6        const yearData = { year: years[i] };7
8        for (const label of labels) {9            const el = generatedData[label].find((el) => el.year === yearData.year);10            yearData[label] = el ? el.value : '0';11        }12
13        chartData.push(yearData);14    }15
16    return chartData;17}
For example, to get the data for gold from year 500 to 1000, you would call the method like this:
1generateChartData(['gold'], [500, 1000]);Gameface components
In the sample, we also used various Gameface components such as gameface-tabs , gameface-grid , gameface-scrollable-container , and gameface-rangeslider to create a more structured and appealing UI.
Updating the range of each chart
We used the gameface-rangeslider component with the two-handles configuration to define the period from and to a specific year.
We listen for the sliderupdate event. When its value changes, the corresponding chart data is regenerated, and the chart’s .update method is called with the new data for the specified range.