Multiplayer UI - Create leaderboard (Part 3)
8/29/2024
Kaloyan Geshev
A games leaderboard ranks players based on performance, fostering competition by showing top scores and achievements. It encourages players to improve and climb the ranks, enhancing engagement in the game.
You can find the rest Multiplayer UI series here.
Showcase Overview
In this tutorial, we’ll build upon the previous multiplayer UI by adding a leaderboard feature. To accommodate this addition, we’ll refactor some of the existing pages, making it easier to integrate the new leaderboard.
Additionally, we’ll enhance the Express server by introducing new endpoints that retrieve user stats for display on the frontend.
Source location
You can find the complete sample source within the ${Gameface package}/Samples/uiresources/UITutorials/MultiplayerUI directory.
srcfolder contains the UI source code.apifolder contains the Express server source code.
Ensure to run npm i before testing the sample.
Refer to the README.md file in this directory for information on running the sample locally or previewing it without building or starting any processes.
Getting started - Backend
We’ll start by updating the backend to include new endpoints that return relevant user stats for the frontend to display on the leaderboard page.
Add additional fields to the user
To store user stats, we’ll extend the user schema in our database by adding two new fields:
1const mongoose = require('mongoose');2
3const schema = new mongoose.Schema({4    firstName: String,5    lastName: String,6    email: String,7    password: String,8    status: Boolean,9    totpSecret: String,10    twoFactorEnabled: Boolean,11    friends: [{ type: String }],12    stats: {13        games: Number,14        wins: Number,15        scores: Number16    }17});18
19module.exports = mongoose.model('user', schema);
The stats object will store data such as games played, wins, and scores.
Creating endpoints to retrieve user stats
When the leaderboard page is accessed, all users’ data will be requested from the server. Additionally, when a user is selected from the table, their specific data will be retrieved.
To facilitate this, we’ll add two new routes to the user routes:
1router.get('/users/rankings', auth, UserController.getUsersRankings);2router.get('/users/:id/rankings', auth, idValidator, UserController.getUserRankings);getUsersRankings method
This method will return the stats data for all users.
1class UserController {2 async getUsersRankings(req, res) {3 const stats = await User.find({}, { 'stats.scores': 1, firstName: 1, lastName: 1 }).sort({ 'stats.scores': -1 });4 if (!stats) return res.status(500).send('Internal server error');5 res.json(stats);6 }7}getUserRankings method
This method will return the stats for a specific user by passing their id in the route params.
1class UserController {2 async getUserRankings(req, res) {3 const userStats = await User.findById(req.params.id, { stats: 1, firstName: 1, lastName: 1 });4 if (!userStats) return res.status(500).send('Internal server error');5 res.json(userStats);6 }7}Adding mock data to the newly registered users
Since our UI isn’t connected to a live game, we need to generate mock user stats when a new user registers. This can be done at the point of registration by adding mock data to our public database, which is used by the sample application.
1class UserController {2 async register(req, res) {3 ...4 try {5 const user = new User({ ...req.body, status: false });6 const totalGames = parseInt(Math.random() * 500);7 // Generate mock stats data for the new user8 user.stats = {9 games: totalGames,10 wins: parseInt(Math.random() * totalGames),11 scores: parseInt(Math.random() * 50000)12 };13 await user.save();14 ...15 }16}Getting started - Frontend
On the frontend, we’ll add a new leaderboard page to display user stats fetched from the server. Additionally, we’ll reorganize our friends page from the previous tutorial for better structure.
Refactor friends files structure
To improve organization, we’ll move the AddFriends and Friends pages into a new Friends folder.
1pages2│ Friends3│ └───FriendsList4| | FriendsList.jsx5| | FriendsList.scss6│ └───AddFriends7| | AddFriends.jsx8| | AddFriends.scss9└───Friends10│ │ Friends.jsx11│ │ Friends.scss12└───AddFriends13 │ AddFriends.jsx14 │ AddFriends.scssAdd friends wrapper page
We’ll create a wrapper component in pages/Friends/FriendsPageWrapper to display both the friends list and add friends pages.
1import React from 'react';2import './FriendsPageWrapper.scss';3import { NavLink, Outlet } from 'react-router-dom';4
5const FriendsPageWrapper = () => {6    return (7        <div className="friends">8            <div className='app-wrapper-sub-navigation'>9                <NavLink className='sub-nav-btn' to="/friends" end>Friends list</NavLink >10                <NavLink className='sub-nav-btn' to="/friends/add-friends">Add friends</NavLink >11            </div>12            <div className="app-wrapper-container">13                <gameface-scrollable-container automatic className="scrollable-container-component">14                    <component-slot data-name="scrollable-content">15                        <Outlet />16                    </component-slot>17                </gameface-scrollable-container>18            </div>19        </div>20    )21}22
23export default FriendsPageWrapper;
Here, NavLink elements are set up for easy navigation between the friends list and add friends pages. The gameface-scrollable-container has been moved from both individual pages to this wrapper for simplicity.
Note: Use the end attribute on the main route (/friends) to ensure the correct NavLink is highlighted when navigating between subroutes.
The Outlet will render the component for the active subroute. Next, we’ll adjust the routing in App.jsx.
Updating routes and adding leaderboard page
In App.jsx, we’ll refactor our existing routes into subroutes and include a route for the leaderboard page.
1<Routes>2 <Route path='/' element={<ProtectedRoute><Home /></ProtectedRoute>} >3 <Route index element={<Friends />} />4 <Route path="/add-friends" element={<AddFriends />} />5 <Route element={<LeaderboardPageWrapper />} >6 <Route index element={<Rankings />} />7 </Route>8 <Route path="friends" element={<FriendsPageWrapper />} >9 <Route index element={<FriendsList />} />10 <Route path="add-friends" element={<AddFriends />} />11 </Route>12 </Route>13 <Route path='/register' element={<Register />} />14 <Route path='/login' element={<Login />} />15 <Route path='/totp' element={<Totp />} />16</Routes>We’ve set the default home route to lead to the rankings subpage within the leaderboard page.
Leaderboard wrapper page
We’ll apply a similar approach to the leaderboard page wrapper as we did with the FriendsPageWrapper.
1import React, { useState } from 'react';2import './LeaderboardPageWrapper.scss';3import { NavLink, Outlet } from 'react-router-dom';4import PlayerStats from '../../../components/PlayerStats';5
6const LeaderboardPageWrapper = () => {7    const [selectedPlayerId, setSelectedPlayerId] = useState('');8
9    return (10        <div className="leader-board">11            <div className='app-wrapper-sub-navigation'>12                <NavLink className='sub-nav-btn' to="/">Rankings</NavLink >13            </div>14            <div className="leader-board-container">15                <div className="app-wrapper-container leader-board-container-outlet">16                    <Outlet context={[selectedPlayerId, setSelectedPlayerId]} />17                </div>18                <PlayerStats id={selectedPlayerId} />19            </div>20        </div>21    )22}23
24export default LeaderboardPageWrapper;
This wrapper contains the rankings table, displayed in the Outlet via the Rankings component that we set up earlier in the router. It also includes the PlayerStats component, which appears on the right when a user is selected from the table. The PlayerStats component shows additional details about the selected player, such as their games, wins, losses, and win rate.
State Sharing
To ensure the PlayerStats component correctly displays data for the selected player, we define a state in the leaderboard page wrapper using const [selectedPlayerId, setSelectedPlayerId] = useState(''); and pass it as context to the Outlet, which is then used by the Rankings component. In Rankings, you can access this context as follows:
1import { useOutletContext } from 'react-router-dom';2...3const [selectedPlayerId, setSelectedPlayerId] = useOutletContext();Using setSelectedPlayerId updates the selectedPlayerId, which reflects in both the LeaderboardPageWrapper state and the PlayerStats component, enabling shared state between components in React. While you could use other state management approaches like redux, this method keeps things simple.
Rankings component
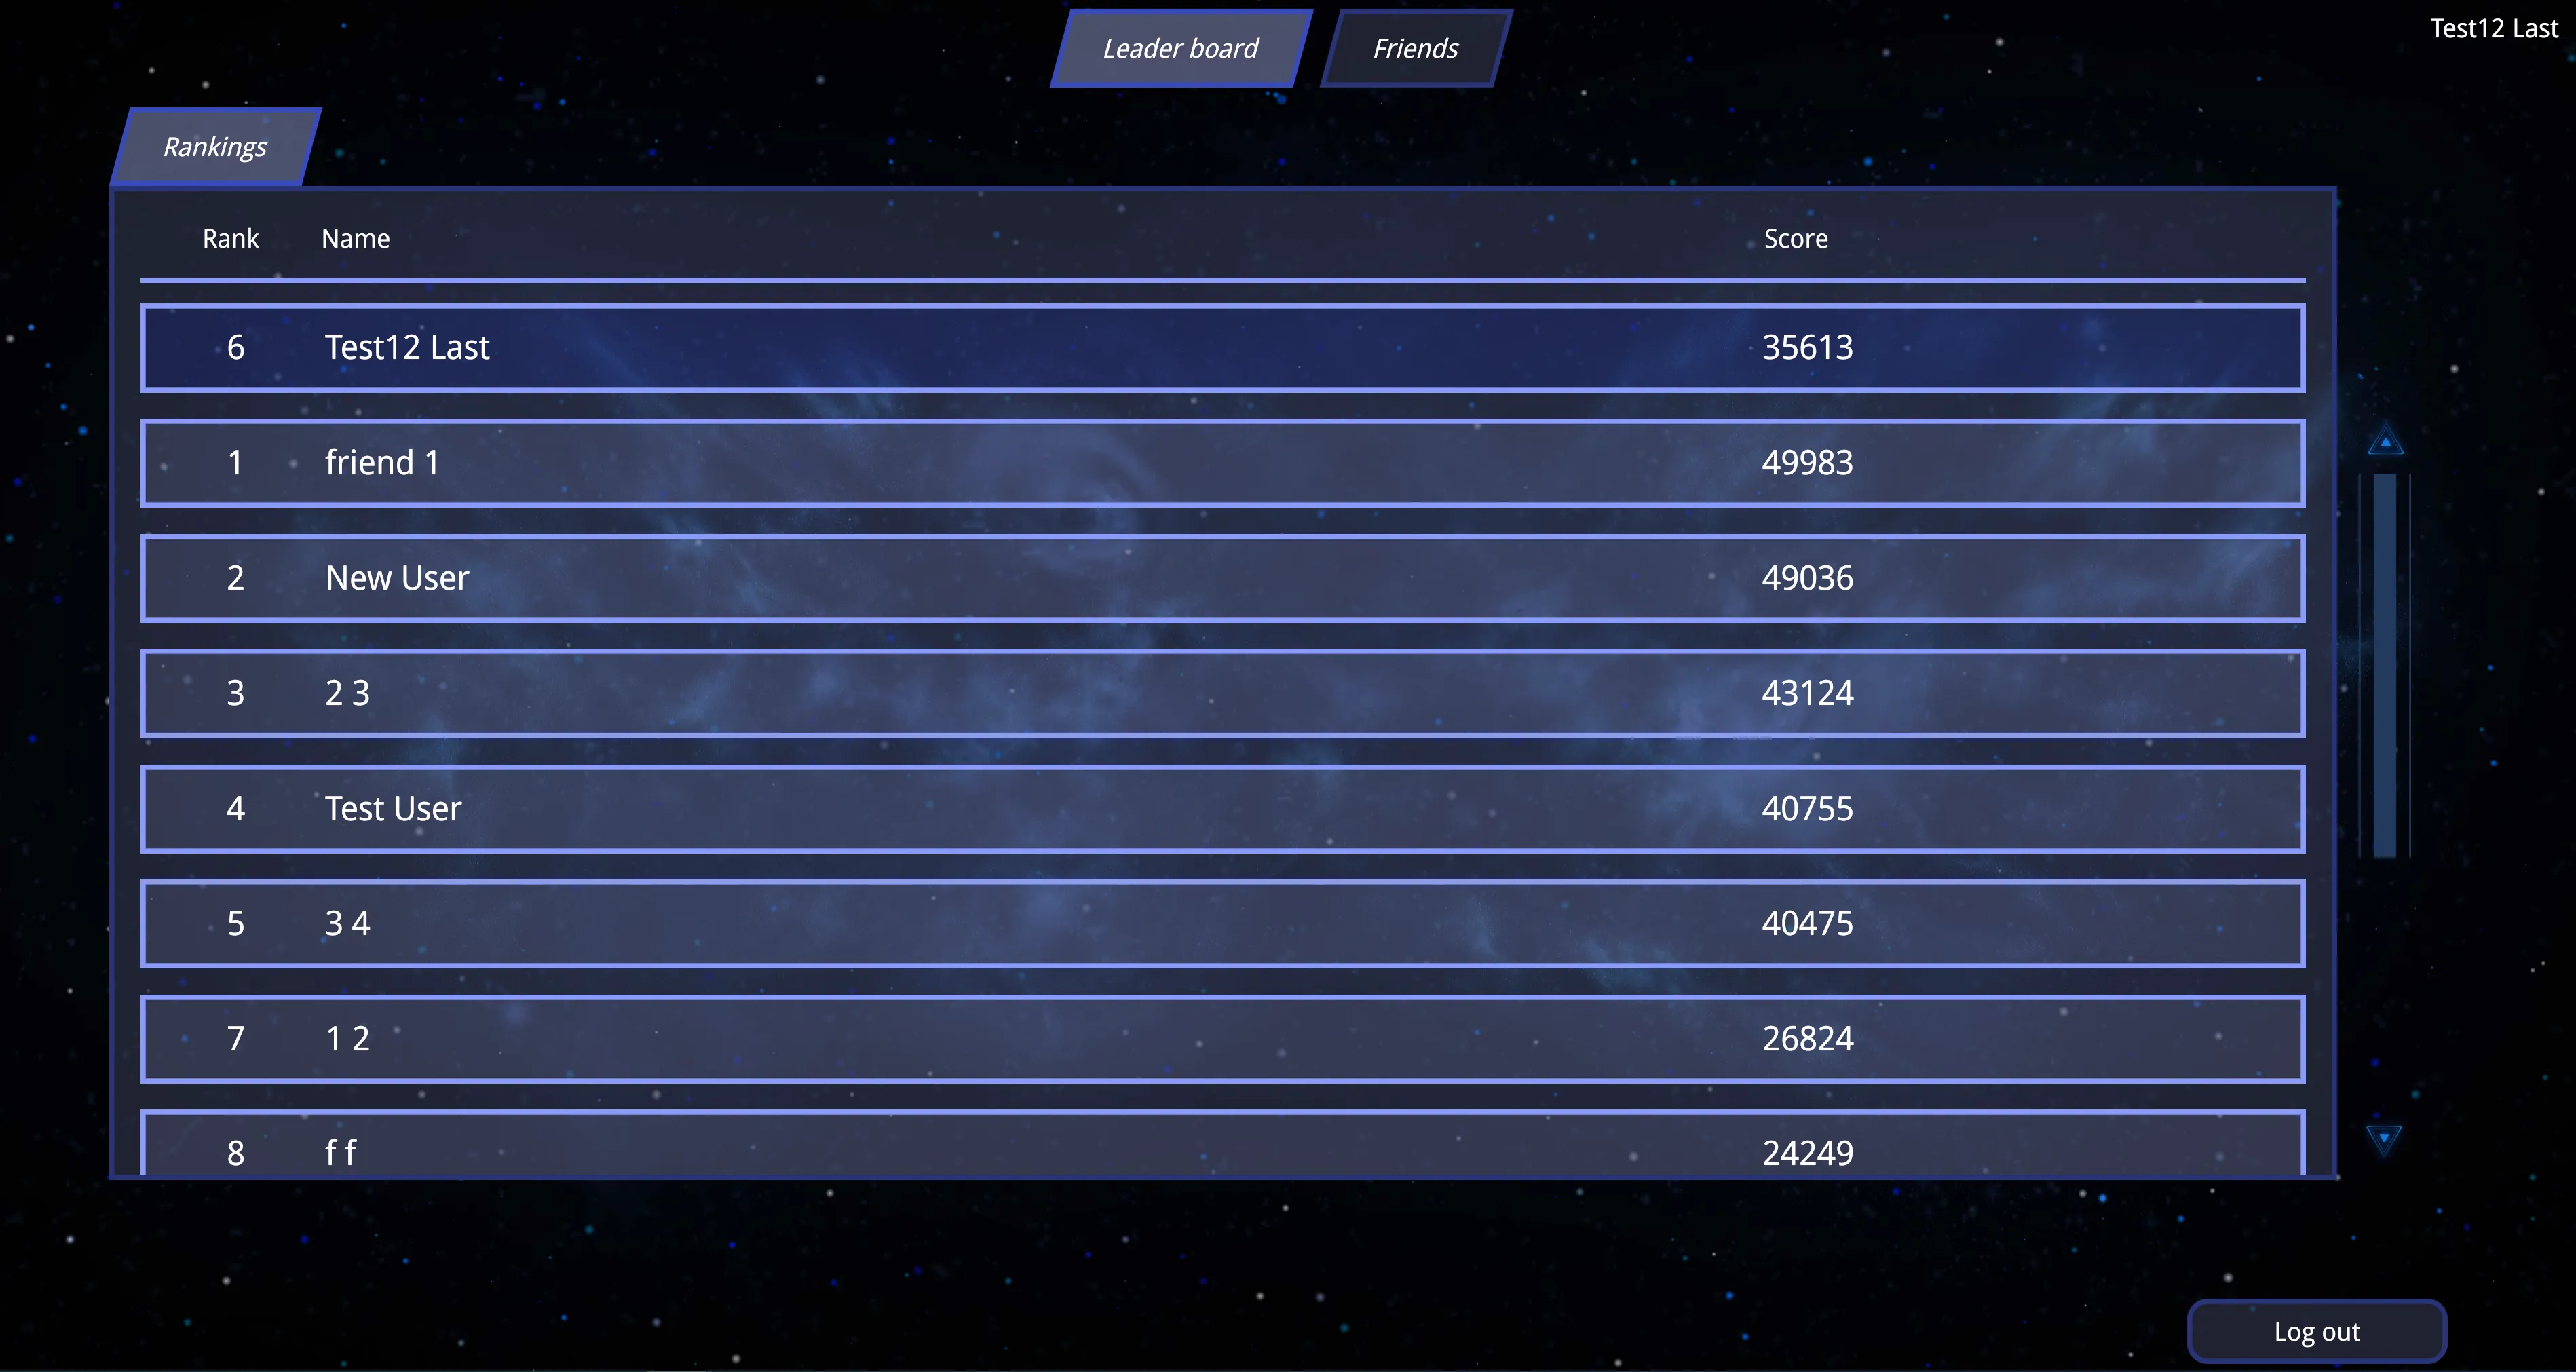
To display the rankings table, we’ll create a new Rankings page that renders within the LeaderboardPageWrapper’s Outlet.
This page includes a loader, a table with headers, the current user’s scores at the top, and a gameface-scrollable-container for the list of other users.
We begin by setting up component states, hooks, and the outlet context:
1const [user] = useLocalStorage('user');2const [selectedPlayerId, setSelectedPlayerId] = useOutletContext();3const [loadingData, setLoadingData] = useState(true);4const [rankingsData, setRankingsData] = useState([]);5const fetch = useFetch();Upon mounting, this component fetches user rankings to display:
1useEffect(() => {2    updateRankingsList();3}, []);4
5const updateRankingsList = useCallback(async () => {6    const [xhr, error] = await fetch('GET', `${process.env.SERVER_URL}/api/users/rankings`);7    if (error) return setLoadingData(false);8    if (error) {9        setLoadingData(false);10        return console.error(error);11    }12    const rankings = JSON.parse(xhr.responseText);13    setLoadingData(false);14    setRankingsData(rankings);15});
As mentioned earlier, shared state allows the player stats panel to open when a user is selected from the table.
1const openPlayerStats = useCallback((event) => {2 const next = event.currentTarget.dataset.id;3 setSelectedPlayerId((prev) => {4 if (prev === next) return '';5 return next;6 });7}, []);To simplify the code, we create memoized variables for the current user’s index and data:
1const [currentUserIndex, currentUserData] = useMemo(() => {2 const userIndex = rankingsData.findIndex((userData) => userData._id === user.id);3 return [userIndex, rankingsData[userIndex]];4}, [rankingsData, user]);Finally, we render the UI:
1return (2    <>3        <Loader className="loader-container" visible={loadingData}></Loader>4        {!loadingData && <UserRankItem5            className="header"6            rank="Rank"7            userName="Name"8            scores="Score" />9        }10
11        {!loadingData && currentUserData && <UserRankItem12            className={`player player-current ${selectedPlayerId === currentUserData._id ? 'player-selected' : ''}`}13            userName={`${currentUserData.firstName} ${currentUserData.lastName}`}14            scores={currentUserData.stats.scores}15            rank={currentUserIndex + 1}16            userId={currentUserData._id}17            onClick={openPlayerStats}18        />}19
20        <gameface-scrollable-container automatic class="players-container">21            <component-slot data-name="scrollable-content">22                {!rankingsData.length && !loadingData && 'No data'}23                {rankingsData.map((user, index) => {24                    if (user._id === currentUserData?._id) return null;25
26                    return <UserRankItem key={user._id}27                        className={`player ${selectedPlayerId === user._id ? 'player-selected' : ''}`}28                        userName={`${user.firstName} ${user.lastName}`}29                        scores={user.stats.scores}30                        rank={index + 1}31                        userId={user._id}32                        onClick={openPlayerStats}33                    />34                })}35            </component-slot>36        </gameface-scrollable-container>37    </>38)
UserRankItem component
The UserRankItem component is used to create the table preview on the Rankings page. It accepts the following props:
rank: The user’s rank to be displayed in the table.userName: The name of the user.userId: The user’s unique ID.scores: The user’s scores.className: Additional classes for the component’s wrapper div.onClick: Event handler triggered when the component is clicked, typically used to open the player’s stats.
1import React from "react";2
3const UserRankItem = ({ rank, userName, userId, scores, className, onClick }) => {4    return <div className={`guic-row ${className}`} data-id={userId} onClick={onClick}>5        <div className='guic-col-1 player-rank'>6            {rank}7        </div>8        <div className='guic-col-8 player-name'>9            {userName}10        </div>11        <div className='guic-col-2 player-score'>12            {scores}13        </div>14    </div>15}16
17export default UserRankItem;
This component uses classes from the gameface-grid component to correctly align its contents.
You can use the UserRankItem component in different layouts within the table:
Table header

To create a table header, set the UserRankItem props like this:
1<UserRankItem className="header" rank="Rank" userName="Name" scores="Score" />User items

To display the current user at the top of the list, use UserRankItem as follows:
1<UserRankItem2 className={`player player-current ${selectedPlayerId === currentUserData._id ? 'player-selected' : ''}`}3 userName={`${currentUserData.firstName} ${currentUserData.lastName}`}4 scores={currentUserData.stats.scores}5 rank={currentUserIndex + 1}6 userId={currentUserData._id}7 onClick={openPlayerStats}8/>For other users, generate the items from the rankingsData array:

1{rankingsData.map((user, index) => {2    if (user._id === currentUserData?._id) return null;3
4    return <UserRankItem key={user._id}5        className={`player ${selectedPlayerId === user._id ? 'player-selected' : ''}`}6        userName={`${user.firstName} ${user.lastName}`}7        scores={user.stats.scores}8        rank={index + 1}9        userId={user._id}10        onClick={openPlayerStats}11    />12})}
If the user in the data matches the current user, skip rendering their UserRankItem since it has already been displayed.
Display player stats when user is selected from the leaderboard
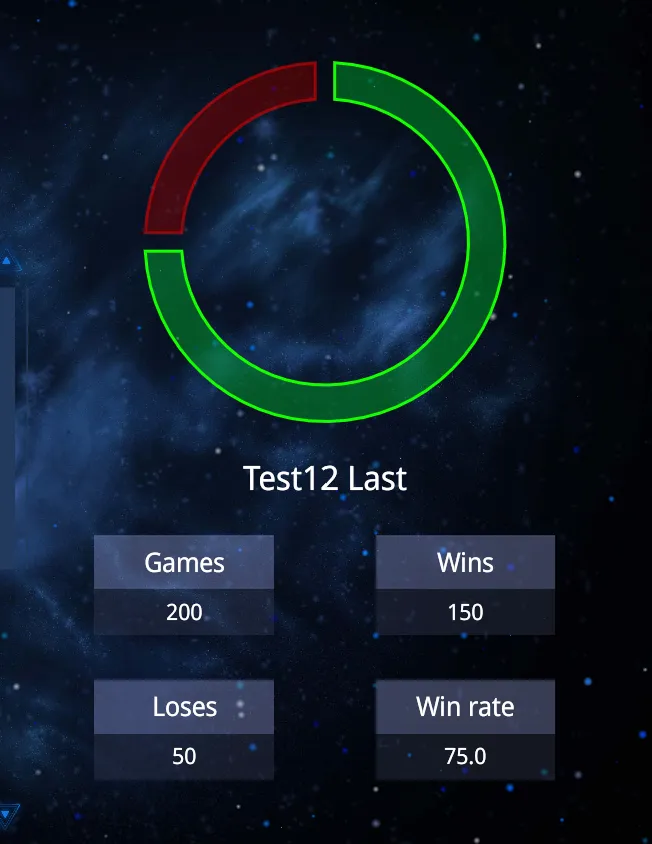
When a user is chosen from the leaderboard table, their stats will appear to the right of the table. To accomplish this, we’ll create a PlayerStats component. This component will show a loading indicator while fetching the user’s data from the server and, once ready, will display the number of games played, wins, losses, and win rate. Additionally, a donut chart will visualize the win/loss ratio.
We’ll start by defining a StatItem component, which will be responsible for displaying each individual stat and its corresponding value:
1const StatItem = ({ title, value }) => {2 return <div className='player-stats-container-item'>3 <div className='player-stats-container-item-title'>{title}</div>4 <div className='player-stats-container-item-data'>{value}</div>5 </div>6}Then we can continue with the PlayerStats component. First we setup the states that the component will use and other things such as using the useDimensions hook that will be needed for making the chart responsive.
Next, we’ll build the PlayerStats component. This involves setting up the necessary state variables and using the useDimensions hook to make the donut chart responsive.
1const fetch = useFetch();2const [loading, setLoading] = useState(false);3const [userData, setUserData] = useState(null);4const loadingTimeoutRef = useRef(null);5const [{ width: chartWidth, height: chartHeight }, chartWrapperRef] = useDimensions(chartWrapperRef);6
7const setLoadingWithTimeout = useCallback((value) => {8    loadingTimeoutRef.current = setTimeout(() => {9        setLoading(value);10        loadingTimeoutRef.current = null;11    }, 300);12}, []);
We then fetch the player’s data from the server when the component mounts:
1useEffect(() => {2    async function getUserData() {3        setLoading(true);4        if (!id) {5            setLoadingWithTimeout(false)6            return setUserData(null);7        }8
9        const [userStatsXhr, error] = await fetch('GET', `${process.env.SERVER_URL}/api/users/${id}/rankings`);10        if (error) return setLoadingWithTimeout(false);11        setUserData(JSON.parse(userStatsXhr.responseText));12        setLoadingWithTimeout(false);13    }14    getUserData();15
16    return () => {17        if (loadingTimeoutRef.current) clearTimeout(loadingTimeoutRef.current);18    }19}, [id]);
To simplify rendering, we define two memoized variables:
1const userStats = useMemo(() => {2    if (!userData) return { games: 0, wins: 0, loses: 0, winRate: 0 };3
4    return {5        games: userData.stats.games,6        wins: userData.stats.wins,7        loses: userData.stats.games - userData.stats.wins,8        winRate: (userData.stats.wins / userData.stats.games * 100).toFixed(1)9    };10}, [userData]);11
12const chartData = useMemo(() => {13    return [14        { name: 'Wins', value: userStats.wins },15        { name: 'Loses', value: userStats.loses }16    ]17}, [userStats])
Finally, we’re ready to render the PlayerStats component:
1return <div className={`leader-board-player ${id ? 'leader-board-player-visible' : ''}`}>2 <Loader className="leader-board-player-loader" visible={loading}></Loader>3 <div className={`player-stats ${!id || loading ? 'player-stats-invisible' : ''}`}>4 <div ref={chartWrapperRef} className='player-stats-graph'>5 <DonutChart width={chartWidth} height={chartHeight} data={chartData} />6 </div>7 {!userData && 'Unable for fetch user data.'}8 {userData && <>9 <div className='player-stats-name'>{userData.firstName} {userData.lastName}</div>10 <div className='player-stats-container'>11 <StatItem title="Games" value={userStats.games} />12 <StatItem title="Wins" value={userStats.wins} />13 <StatItem title="Loses" value={userStats.loses} />14 <StatItem title="Win rate" value={userStats.winRate} />15 </div>16 </>17 }18 </div>19</div>StatItem component
The StatItem component is stateless and serves to display data fetched from the server.
Loading indicator timeout
A loading indicator with a timeout is added to give the donut chart enough time to render and load the data.
useDimensions hook
To make the donut chart responsive, a useDimensions hook is used. This hook observes the dimensions of the chart’s parent element, updating the chart’s dimensions whenever the parent’s size changes.
1import React, { useEffect, useRef, useState } from 'react';2
3export const useDimensions = () => {4    const ref = useRef(null);5    const resizeObserverRef = useRef(null);6
7    const getDimensions = () => {8        return {9            width: ref.current ? ref.current.offsetWidth : 0,10            height: ref.current ? ref.current.offsetHeight : 011        };12    };13
14    const [dimensions, setDimensions] = useState(getDimensions);15
16    const handleResize = () => {17        const parentDimensions = getDimensions();18        if (parentDimensions.width !== dimensions.width || parentDimensions.height !== dimensions.height) {19            setDimensions(parentDimensions);20        }21    };22
23    useEffect(() => {24        resizeObserverRef.current = new ResizeObserver(handleResize);25        if (ref.current) resizeObserverRef.current.observe(ref.current);26
27        return () => {28            if (resizeObserverRef.current) resizeObserverRef.current.disconnect();29        };30    }, [ref]);31
32    return [dimensions, ref];33}
Instead of watching for document resize, we use ResizeObserver to monitor changes to the dimensions of the chart’s parent element.
DonutChart component

We’ll use the d3 library to create a donut chart in React. A post describing how to use this library in Gameface with plain JavaScript can be found here.
1import React, { useEffect, useMemo } from "react";2import * as d3 from "d3";3import './DounutChart.scss';4
5const colors = [6    { fill: '#009B2C80', stroke: '#15FF00' },7    { fill: '#81000080', stroke: '#FF000080' },8]9
10const STOKE_WIDTH = 3;11
12const getArcsConfig = (radius, arcData) => {13    return {14        innerRadius: parseInt(radius * 0.80),15        outerRadius: radius,16        startAngle: arcData.startAngle,17        endAngle: arcData.endAngle,18    }19}20
21export const DonutChart = ({ width, height, data }) => {22    const radius = useMemo(() => {23        return (Math.min(width, height) / 2) - STOKE_WIDTH - 20;24    }, [width, height]);25
26    const pie = useMemo(() => {27        const pieGenerator = d3.pie().value((d) => d.value).sort(null);28        return pieGenerator(data);29    }, [data]);30
31    const arcs = useMemo(() => {32        const arcPathGenerator = d3.arc().padAngle(0.08);33        return pie.map((p) => arcPathGenerator(getArcsConfig(radius, p)));34    }, [radius, pie]);35
36    useEffect(() => {37        d3.selectAll('.pie-group-arc').transition().duration(500).delay(250)38            .attrTween('d', (d, i) => {39                const interpolate = d3.interpolate({ startAngle: 0, endAngle: 0 }, pie[i]);40
41                return (t) => {42                    const arcPathGenerator = d3.arc().padAngle(0.08);43                    return arcPathGenerator(getArcsConfig(radius, interpolate(t)));44                };45            });46    }, [pie]);47
48    return (49        <svg className="pie" viewBox={`0 0 ${width} ${height}`}>50            <g className="pie-group" style={{ transform: `translate(${(width / 2)}px, ${(height / 2)}px)` }}>51                {arcs.map((arc, i) => {52                    const { fill, stroke } = colors[i];53                    return <path className="pie-group-arc" key={i} d={arc} fill={fill} stroke={stroke} strokeWidth={STOKE_WIDTH} />;54                })}55            </g>56        </svg >57    );58};
Calculating the chart radius
The outer radius of the chart is recalculated dynamically based on the width and height of the parent element. This ensures the chart is responsive, adjusting each time the parent size changes.
Generating the pie
A new pie chart is generated whenever the chart data changes. The data passed from the PlayerStats component represents the user’s wins and losses, regenerating the pie whenever a different user is selected.
Generating the arcs
The arcs of the chart are generated based on the outer radius and the pie data. They will regenerate if either the radius or the user data changes.
Animating the arcs
To animate the arcs when created, the useEffect hook is used to handle the animation when the chart is mounted or the pie data changes.
Making the chart responsive
To make the chart responsive, the svg element needs the viewBox attribute set dynamically:
1<svg className="pie" viewBox={`0 0 ${width} ${height}`}>Additionally, the group holding the arcs should be moved to the center of the svg element:
1<g className="pie-group" style={{ transform: `translate(${(width / 2)}px, ${(height / 2)}px)` }}>